|
Red Queen Simulator |
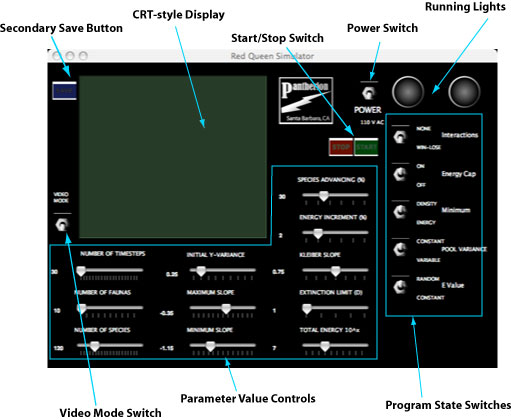
User's ManualThe Red Queen Simulator allows a user to follow the trajectories, over time, of size-abundance regressions in communities, and to observe the effects on these trajectories of evolutionary "winner-loser" interactions among the species. The simulation, its assumptions and scientific relevance are described in Damuth (2007) and in a brief set of notes for users wanting a rapid outline orientation. 1. Upon successful launch, the user is presented with this graphical display, which is reminiscent of a conventional electronic laboratory device of the last century:
Before a simulation run, users can modify many parameters and program states. Quick Start: The default values at startup will perform a quick simulation of 10 faunas for 30 timesteps each, with species interactions turned on. This will allow you to explore how the application works with some reasonable settings. IMPORTANT: Nothing will happen until you turn on the Power Switch!
|
© Pantherion Corp.
2007 |